Any links to online stores should be assumed to be affiliates. The company or PR agency provides all or most review samples. They have no control over my content, and I provide my honest opinion.
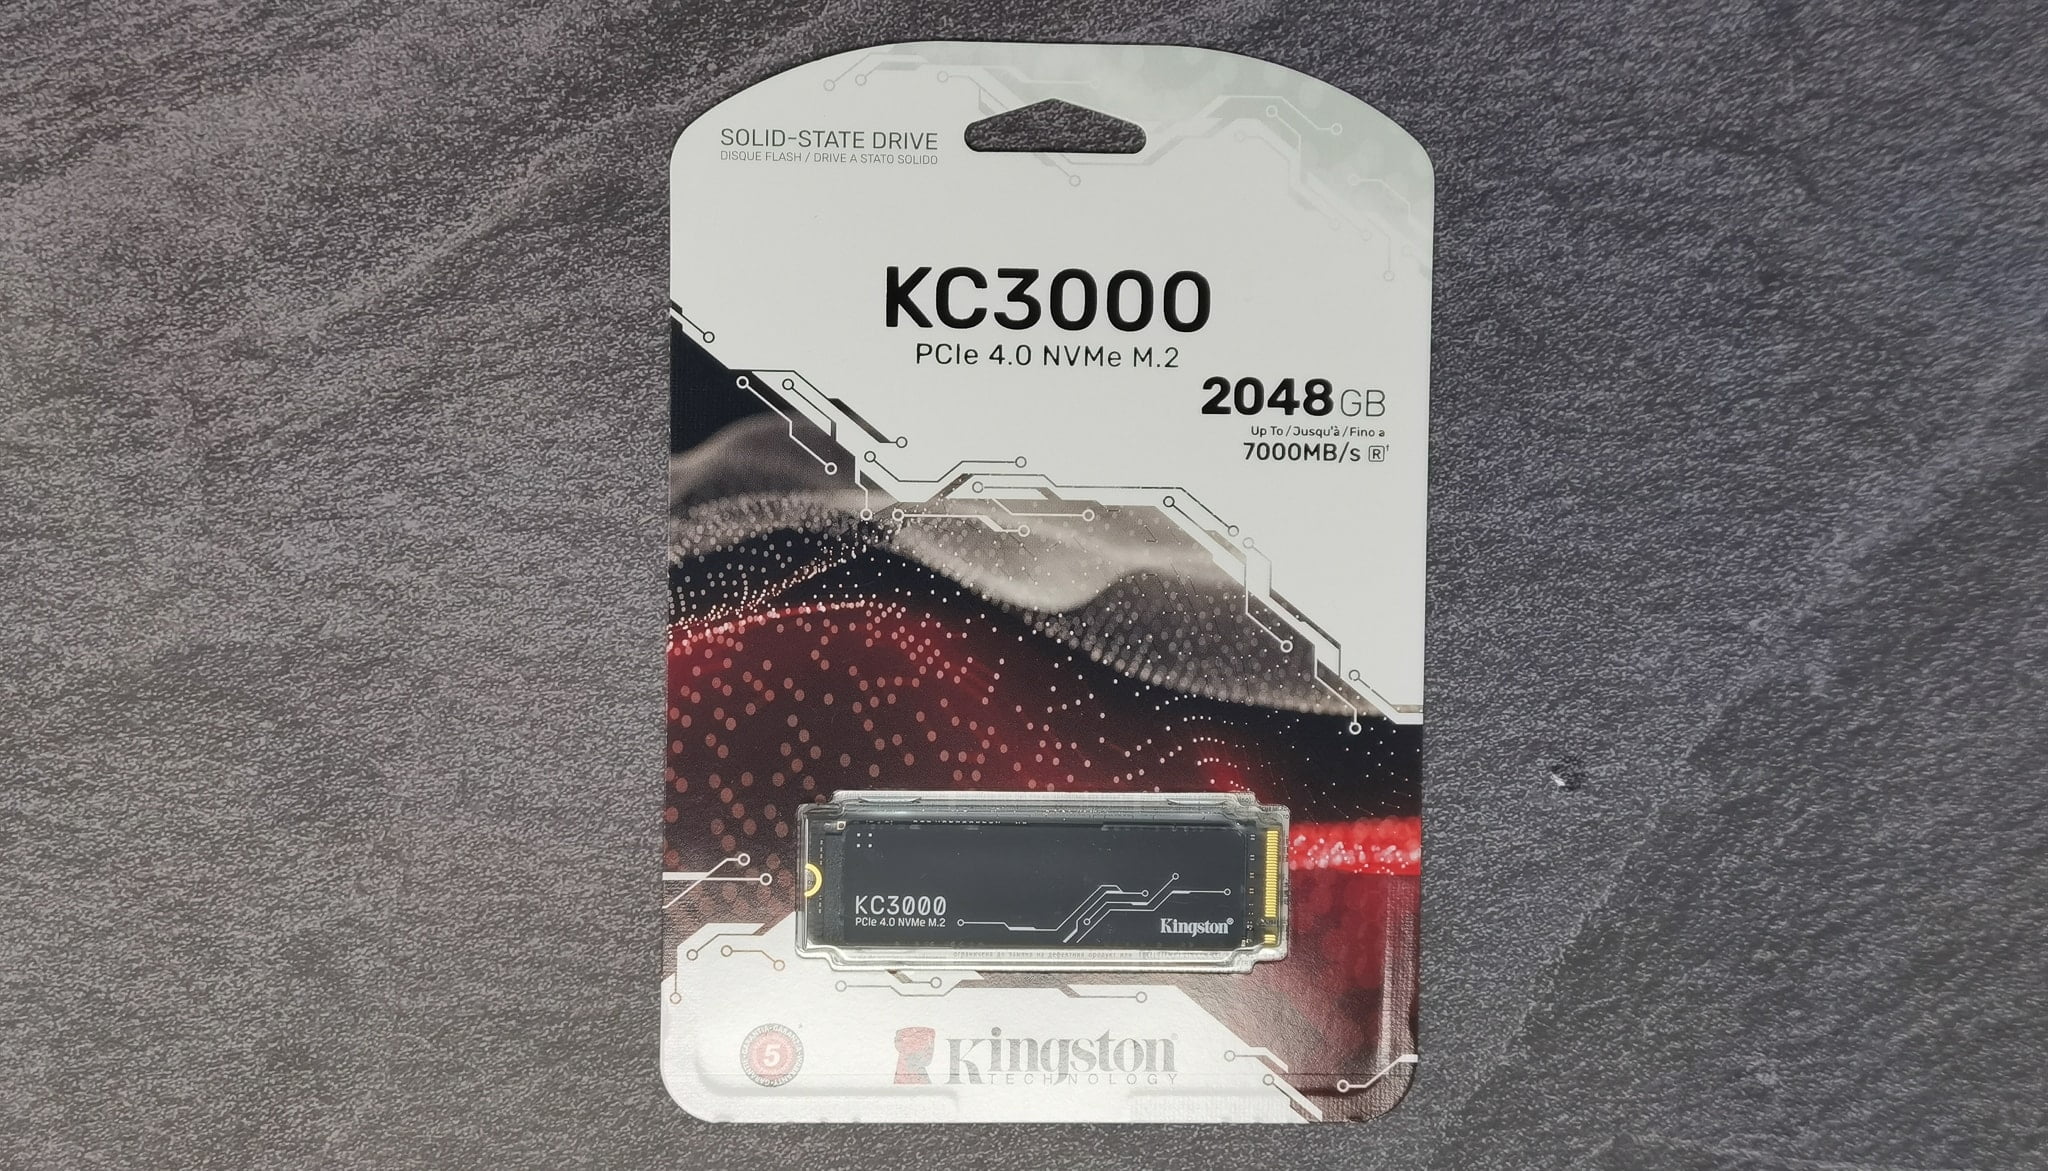
Kingston was a bit slower to the market with their PCIe 4.0 NVMe drives, but late last year they launched two new drive models. The Kingston KC3000, which is aimed towards work and professional computing, and the Kingston Fury is geared towards gaming.
The main difference between these two new models is the Kingston Fury has around 5% faster read speeds and a significant 25% increase in the endurance rating. The 2TB Kingston KC3000 I am reviewing today is rated at 1.6PBW, which is already up there with the best, but the Fury is rated at 2.0PBW.
| Preview | Product | Rating | Price | |
|---|---|---|---|---|

| Kingston KC3000 PCIe 4.0 NVMe M.2 SSD - High-performance... |
£78.29 | Buy on Amazon | |

| Kingston KC3000 PCIe 4.0 NVMe M.2 SSD - High-performance... | £135.60 | Buy on Amazon |
Sony Playstation 5 Comptability
Kingston advertises the Fury as being PS5 compatible, however, both drives meet the specification required for the PS5. The recommended drive read speed is just 5500MB/s, and most/all PCIe 4.0 drives should achieve this.
I assume the high endurance of the Kingston Fury is so that gamers can install and delete large games without worry.
However, neither drive comes with a built-in heat sink, and this is a recommendation for any drive used with the PS5. They are cheap to buy with plenty of compatible heatsinks on Amazon.
Kingston KC3000 vs Fury NVMe vs KC2500 Specification
| Kingston | FURY Renegade | KC3000 |
|---|---|---|
| Form factor | M.2 2280 | M.2 2280 |
| Interface | PCIe 4.0 x4 NVMe | PCIe 4.0 x4 NVMe |
| Capacities2 | 500GB, 1TB, 2TB, 4TB | 512GB, 1024GB, 2048GB, 4096GB |
| Controller | Phison E18 | Phison E18 |
| NAND | 3D TLC | 3D TLC |
| Sequential read/write1 | 500GB – 7,300/3,900MB/s 1TB – 7,300/6,000MB/s 2TB – 7,300/7,000MB/s 4TB – 7,300/7,000MB/s | 512GB – 7,000/3,900MB/s 1024GB – 7,000/6,000MB/s 2048GB – 7,000/7,000MB/s 4096GB – 7,000/7,000MB/s |
| Random 4K read/write1 | 500GB – up to 450,000/900,000 IOPS 1TB – up to 900,000/1,000,000 IOPS 2TB – up to 1,000,000/1,000,000 IOPS 4TB – up to 1,000,000/1,000,000 IOPS | 512GB – up to 450,000/900,000 IOPS 1024GB – up to 900,000/1,000,000 IOPS 2048GB – up to 1,000,000/1,000,000 IOPS 4096GB – up to 1,000,000/1,000,000 IOPS |
| Total Bytes Written (TBW)3 | 500GB – 500TBW 1TB – 1.0PBW 2TB – 2.0PBW 4TB – 4.0PBW | 512GB – 400TBW 1024GB – 800TBW 2048GB – 1.6PBW 4096GB – 3.2PBW |
| Power consumption | 500GB – 5mW idle / 0.34W avg / 2.7W (MAX) read / 4.1W (MAX) write 1TB – 5mW idle / 0.33W avg / 2.8W (MAX) read / 6.3W (MAX) write 2TB – 5mW idle / 0.36W avg / 2.8W (MAX) read / 9.9W (MAX) write 4TB – 5mW idle / 0.36W avg / 2.7W (MAX) read / 10.2W (MAX) write | 512GB – 5mW idle / 0.34W avg / 2.7W (MAX) read / 4.1W (MAX) write 1024GB – 5mW idle / 0.33W avg / 2.8W (MAX) read / 6.3W (MAX) write 2048GB – 5mW idle / 0.36W avg / 2.8W (MAX) read / 9.9W (MAX) write 4096GB – 5mW idle / 0.36W avg / 2.7W (MAX) read / 10.2W (MAX) write |
| Storage temperature | -40°C~85°C | -40°C~85°C |
| Operating Tempetemperaturerature | 0°C~70°C | 0°C~70°C |
| Dimensions | Heat spreader: 80mm x 22mm x 2.21mm (500GB-1TB) 80mm x 22mm x 3.5mm (2TB-4TB) Heatsink: 80mm x 23.67mm x 10.5mm | 80mm x 22mm x 2.21mm (512GB-1024GB) 80mm x 22mm x 3.5mm (2048GB-4096GB) |
| Weight | Heat spreader: 2TB-4TB – 9.7g Heatsink: 500GB-1TB – 32.1g 2TB-4TB – 34.9g | 512GB-1024GB – 7g 2048GB-4096GB – 9.7g |
| Vibration operating | 2.17G peak (7-800Hz) | 2.17G peak (7-800Hz) |
| Vibration non-operating | 20G peak (20-1000Hz) | 20G Peak (20-1000Hz) |
| MTBF | 1,800,000 hours | 1,800,000 hours |
| Warranty/Support4 | Limited 5-year warranty with free technical support | Limited 5-year warranty with free technical support |
Kingston KC3000 vs KC2500 Performance / Benchmarks
My current system consists of:
- AMD Ryzen 7 5800X
- MSI MEG X570 UNIFY
- NVIDIA GeForce RTX 3080
- 32GB Kingston Fury Renagade 3600Mhz RAM
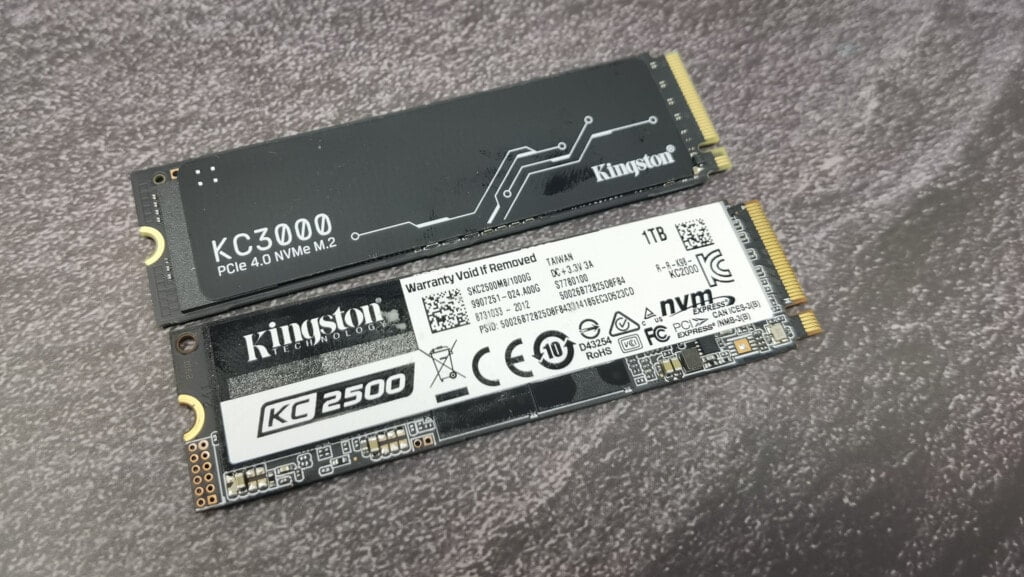
The Kingston KC3000 is now being used as my main Windows drive, and I was previously using the excellent PCIe 3.0 based Kingston KC2500.
Thermal Throttling
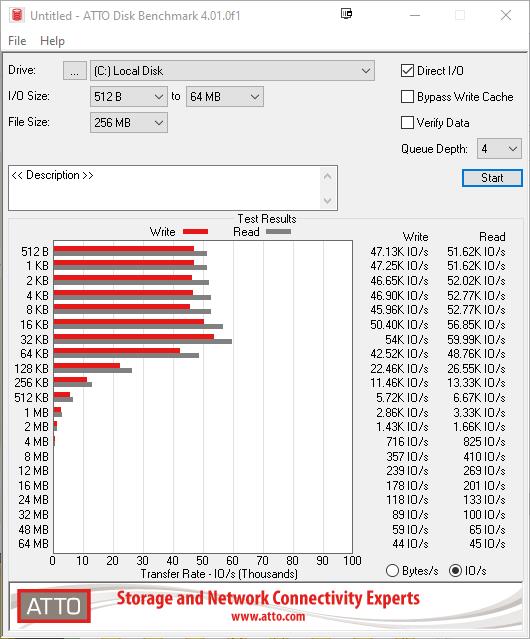
When I initially installed the drive it was without a heatsink and I didn’t really think anything of it. However, some of the benchmarks I ran generated unusual results. The results were still great but there would be the occasional drop off in performance. ATTO Disk Benchmark was particularly odd, towards the end of the benchmark when it is writing the larger files, speeds dropped off. With me using this as my primary Windows drive, my initial assumption was that it was other applications getting in the way of the read/writes. These issues persisted no matter what I did and I eventually came to the conclusion of thermal throttling.
As soon as I fitted a heatsink, the benchmarks generated the results I had expected.
Heatsinks for NVMe drives have been a thing for years now many motherboards include them as part of the design. In the past, I haven’t noticed that much difference in performance when not using one, but it would seem the increased performance of PCIe 4.0 drives means increased heat.
Benchmarks put the drive under more strain than most real-life scenarios so throttling may not be a significant issue for most workloads, but considering you can pick up a heatsink for, under a tenner, I’d say they are an essential purchase. This applies to all NVMe drives, not just Kingston and it is the reason why the PS5 also requires a heatsink.
Crystal Disk Mark
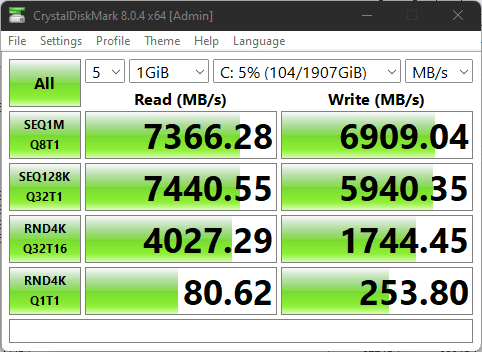
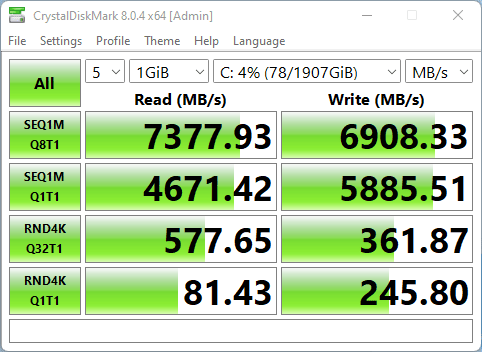

As you’d expect, there is a significant improvement with all of the benchmark results across the board. Sequential speeds are the big improvements with reading and write speeds more than doubling for Q8T1 and Q32T16.
Even looking at the random 4k Q1T1 results, you are getting a 30% and 39% improvement for read and write, respectively.
ATTO Disk Benchmark
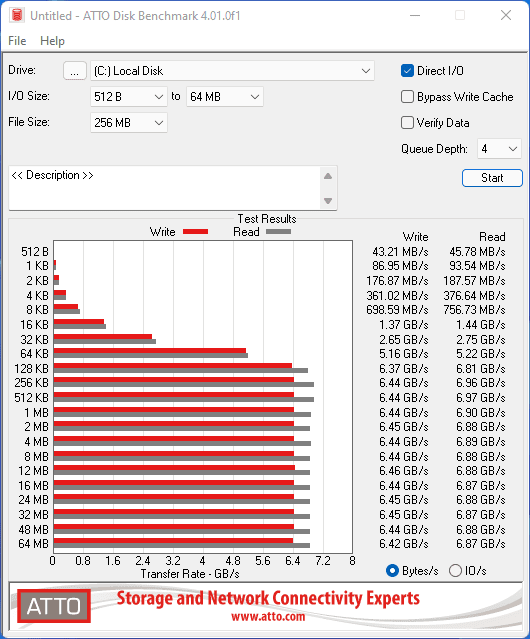
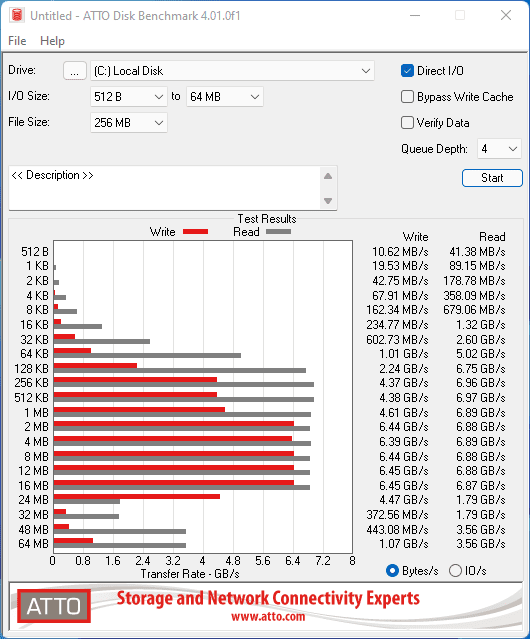
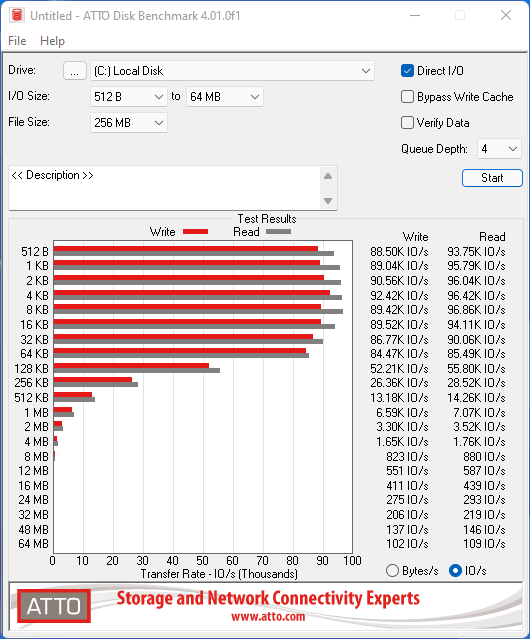
ATTO reflects the Crystal Disk Mark results and also shows significant improvements with the IO/s. In the above screenshots, you can see the drive starts to significantly throttle performance at the end of the test.
The below images shows the input-output performance is roughly double for most of the files sizes.
Anvil Storage Utilities
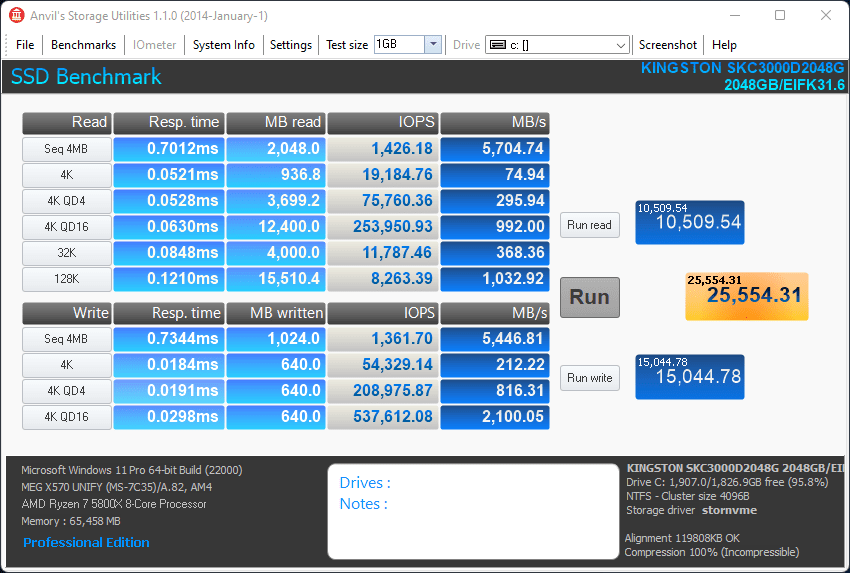
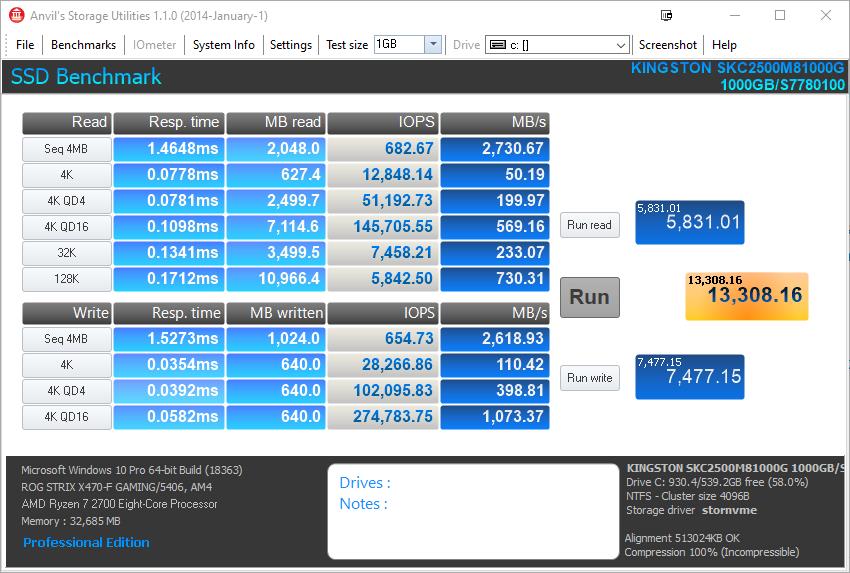
Again, the KC3000 almost doubles the scores of the KC2500. Here we see significant improvements in IOPs and response time.
Prior to adding the heatsink, I had to rerun the write test twice before I got the expected results
Final Fantasy XIV: Shadowbringers Benchmark
With the Kingston KC3000 achieving such high benchmark scores compared to the KC2500, how does this affect gaming?
The Final Fantasy XIV: Shadowbringers is still a benchmark, but it should help provide some insight into how the Kingston KC3000 can improve game load speeds.
For this test, I run the benchmark in its default settings which is high and 1080p.
In this scenario, there is a 36.8% improvement in load times between each scene.
Kingston KC3000
Loading Times by Scene
- Scene #1: 1.736 sec
- Scene #2: 2.063 sec
- Scene #3: 3.258 sec
- Scene #4: 1.301 sec
- Scene #5: 0.612 sec
- Total Loading Time: 8.97 sec
Kingston KC2500 NVMe
Total benchmark Score: 12829
Loading Times by Scene
- Scene #1: 2.146 sec
- Scene #2: 3.509 sec
- Scene #3: 4.172 sec
- Scene #4: 2.887 sec
- Scene #5: 1.509 sec
- Total Loading Time: 14.223 sec
3DMark Storage Benchmark
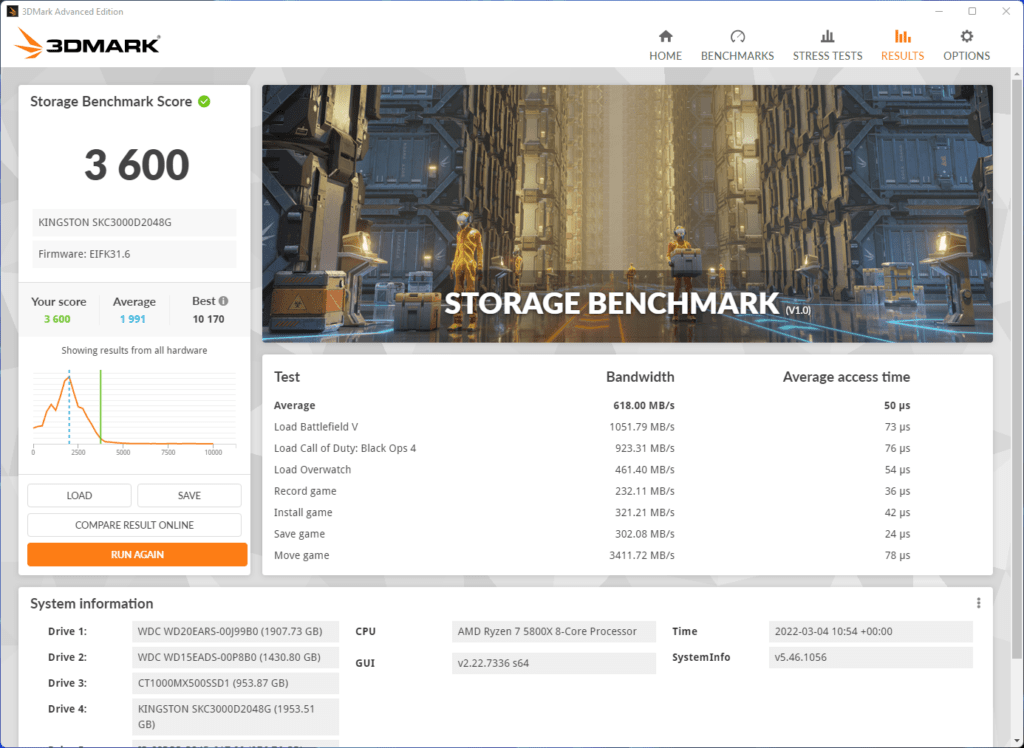
3DMark has a new SSD benchmarking utility which simulates gaming-related activities to measure real-world gaming performance. This includes tests such as
- Loading Battlefield V from launch to the main menu.
- Loading Call of Duty: Black Ops 4 from launch to the main menu.
- Loading Overwatch from launch to the main menu.
- Recording a 1080p gameplay video at 60 FPS with OBS (Open Broadcaster Software) while playing Overwatch.
For comparison, when the benchmark launched, 3DMark posted on Steam the median scores for several 1TB drives:
| Device | Median score |
|---|---|
| WD_BLACK SN850 NVMe 1 TB | 3426 |
| Samsung SSD 980 PRO 1 TB | 2817 |
| Samsung SSD 980 1 TB | 2434 |
| Sabrent Rocket 4.0 1 TB | 2315 |
| Samsung SSD 970 EVO Plus 1 TB | 2189 |
| Samsung SSD 970 PRO 1 TB | 2096 |
| Corsair Force Series Gen.4 PCIe MP600 | 2062 |
| WD_BLACK SN750 NVMe 1 TB | 2056 |
| WD Blue SN550 NVMe 1 TB | 1992 |
| Samsung SSD 970 EVO 1 TB | 1908 |
I should point out that many users using similar PCIe 4.0 drives get similar results to mine and some users getting over 4K. Again, this is quite likely the difference in cooling.
Price and Alternative Options
At the time of writing, the Kingston KC3000 is priced at:
Amazon
- 512GB: £114.26
- 1024GB: £152.83
- 2048GB: £355.44
Insight:
- 512GB: ££96
- 1024GB: £156
- 2048GB: £312
Kingston Fury
- 512GB: £102
- 1024GB: £164
- 2048GB: £307
Samsung 980 PRO
Lower write speeds and 25% lower endurance
- 512GB: £88
- 1024GB: £160
- 2048GB: £335.97
WD_BLACK SN850
Lower write speeds and 25% lower endurance
- 512GB: £85
- 1024GB: £140
- 2048GB: £250 to £350 when available
As always for storage, the price varies a lot and frequently. The Kinston KC3000 isn’t priced that attractively on Amazon, but it has only been on there for a couple of months, while competing models have been available for much longer.
Overall
The Kingston KC3000 PCIe 4.0 is an outstanding drive that provides a significant improvement in performance from the PCIe 3.0 based KC2500.
Compared to other PCIe 4.0 drives, it has one of the best specs on the market. It has a significantly higher write speed and endurance than the Western Digital and Samsung equivalents. It probably won’t make that much difference in the real world, but the Kingston is priced attractively enough that it should be a serious consideration over the other brands.
Kingston KC3000 PCIe 4.0 NVMe Review Rating
Summary
The Kingston KC3000 has incredible performance and is a significant upgrade from the previous KC2500. It has a significantly higher endurance rating than many other competing drives and this makes it ideal for demanding work environments.
Overall
90%-
Overall - 90%90%
Pros
- Incredible speeds with double the performance in many benchmarks vs previous generation
- One of the highest endurance ratings on the market
Cons
- Like all PCIe 4.0 drives, it runs hot and you should factor in the cost of a heatsink if you don’t have one included with your motherboard.
I am James, a UK-based tech enthusiast and the Editor and Owner of Mighty Gadget, which I’ve proudly run since 2007. Passionate about all things technology, my expertise spans from computers and networking to mobile, wearables, and smart home devices.
As a fitness fanatic who loves running and cycling, I also have a keen interest in fitness-related technology, and I take every opportunity to cover this niche on my blog. My diverse interests allow me to bring a unique perspective to tech blogging, merging lifestyle, fitness, and the latest tech trends.
In my academic pursuits, I earned a BSc in Information Systems Design from UCLAN, before advancing my learning with a Master’s Degree in Computing. This advanced study also included Cisco CCNA accreditation, further demonstrating my commitment to understanding and staying ahead of the technology curve.
I’m proud to share that Vuelio has consistently ranked Mighty Gadget as one of the top technology blogs in the UK. With my dedication to technology and drive to share my insights, I aim to continue providing my readers with engaging and informative content.
Last update on 2025-07-09 / Affiliate links / Images from Amazon Product Advertising API

